mirror of
https://github.com/Haxxnet/Compose-Examples
synced 2025-05-04 02:23:35 +00:00
References
- https://blog.lrvt.de/monitoring-dashboard-with-grafana-telegraf-influxdb-and-docker/
- https://blog.lrvt.de/log-visualization-with-grafana-loki-promtail/
Notes
Spawning up this docker stack will provide you with:
- A containerized Grafana web instance runnning on the default port TCP/3000
- A containerized Telegraf instances that fetches data points from your docker host server
- A containerized InfluxDB instance for storing Telegraf data, which can be defined in Grafana as datasource (just specify
http://influxdb:8086). Default database istelegraf. Default username istelegrafuser. Default password isMyStrongTelegrafPassword. Defaults can be changed in/volume-data/influxdb/init/create-database.iql. - A containerized Promtail instance that can fetch various log and send them into Loki (e.g. /var/log/auth.log or your Traefik reverse proxy logs)
- A containerized Loki instance for storing Promtail data, which can be defined in Grafana as datasource (just specify
http://loki:3100). No authentication enabled per default.
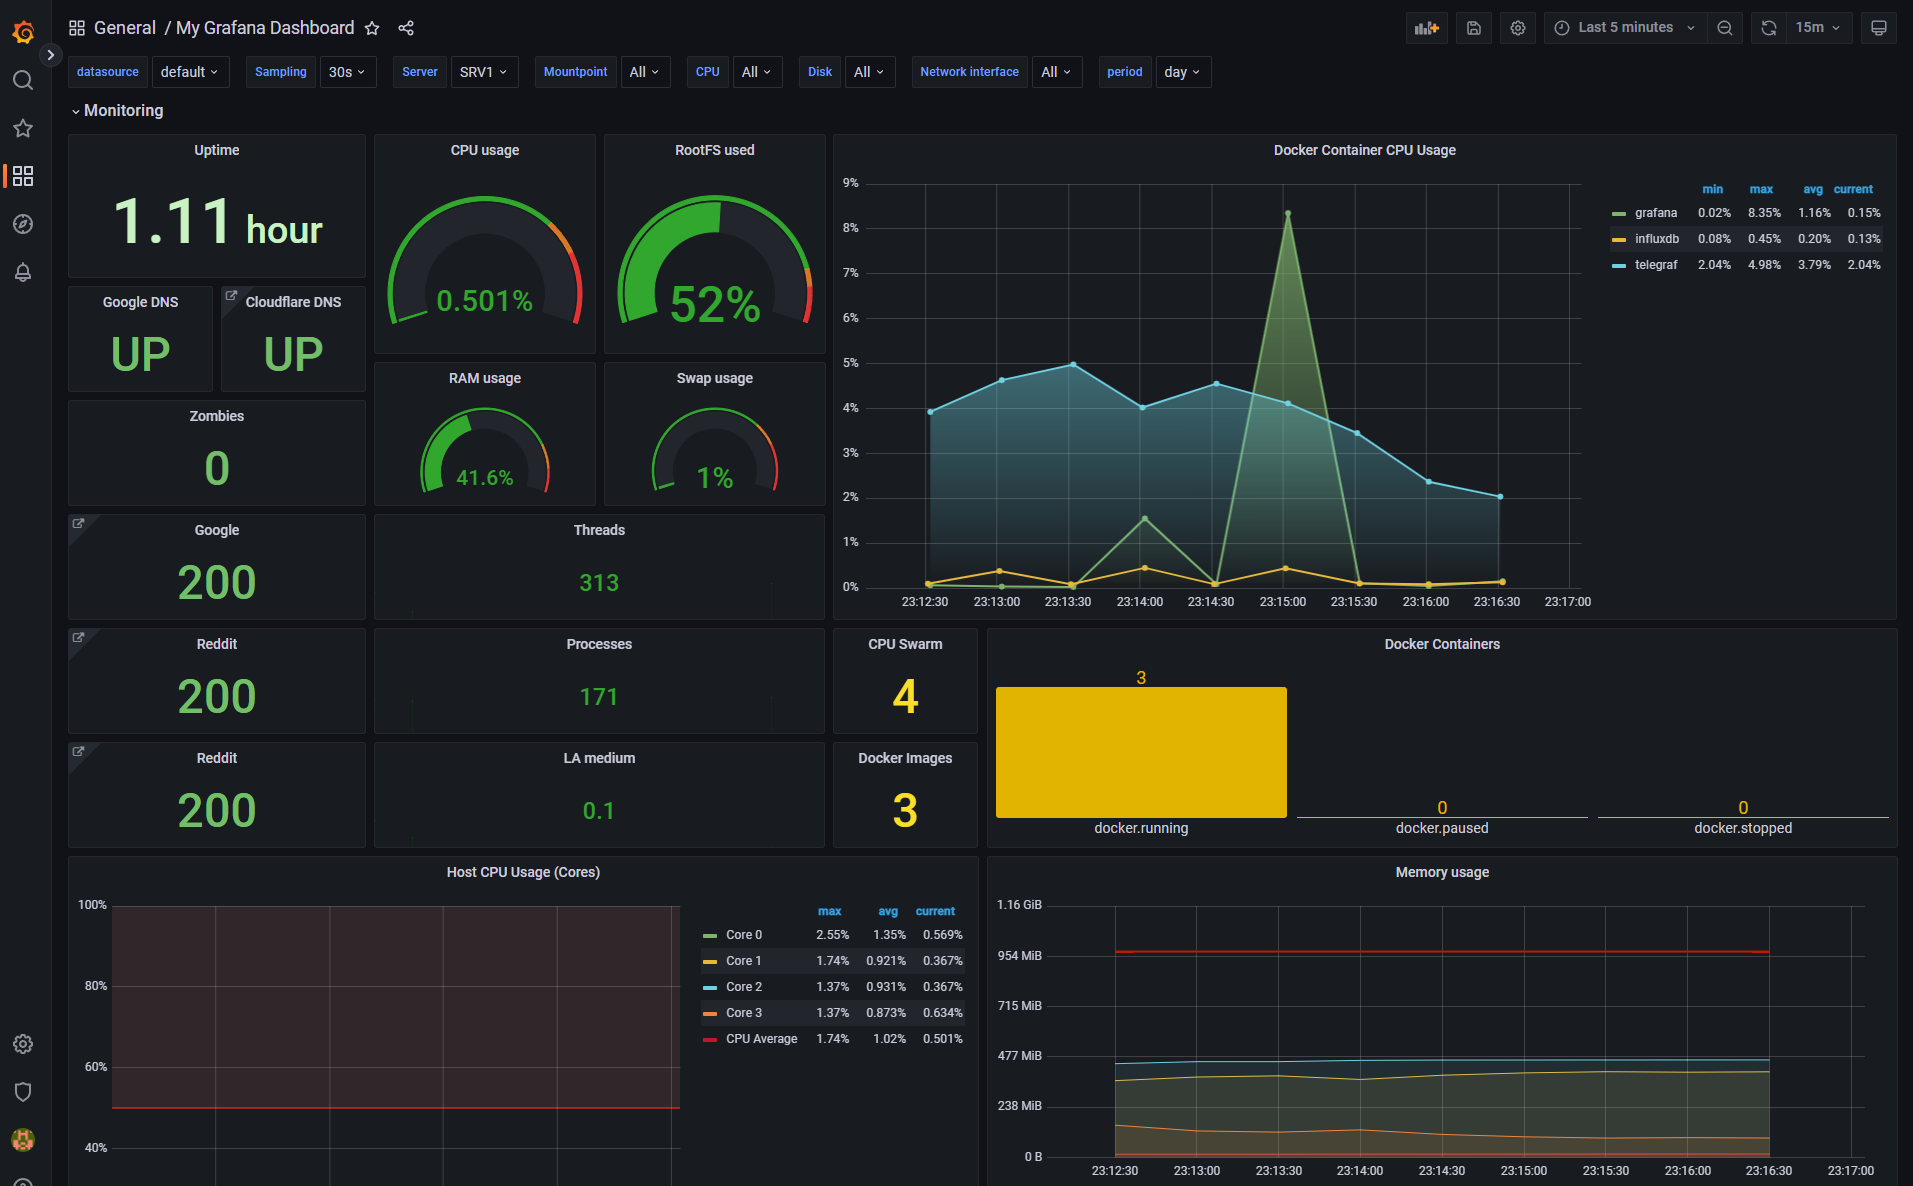
Finally, after configuring InfluxDB and Loki as datasources on Grafana, you can just import the provided Grafana_Dashboard_Template.json dashboard template YAML file in Grafana by browsing http://127.0.0.1:3000/dashboard/import. Your dashboard will look like the following: