mirror of
https://github.com/metafy-social/python-scripts.git
synced 2025-05-09 20:43:57 +00:00
Stock Visualizer
About
A stock visualizer, that uses the Yahoo Finance library to create a customizable graph for the user to see. It will ask the user for input, specifically for the stock symbol, and the start and end dates in the form (YYYY-MM-DD). Then, it will output a graph with those specifications.
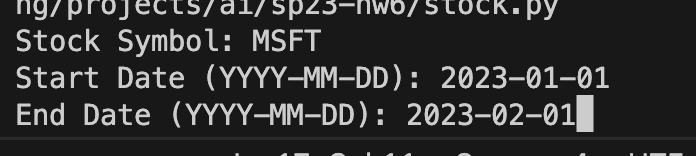
Input Queried from User
Output Graph Generated
